 Download slides
Truckload market tightens as 2026 outlook shifts
Published: Thursday, January 08, 2026 | 12:00 AM CDT
Onthispage
The C.H. Robinson 2026 truckload spot rate forecast is being raised again following the combination of unusually active winter weather in December 2025 and a tighter-than-expected capacity environment. While continued volatility in freight volumes is expected, mostly due to tariff policy, sustained volume growth is not assumed in this forecast.
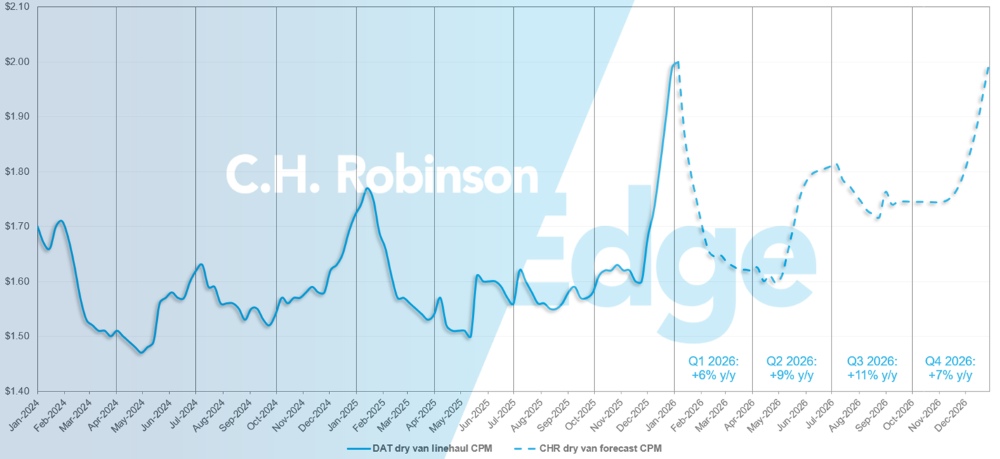
The 2026 outlook has been revised from 6% to approximately 8% year-over-year (y/y) growth, a total 2% increase.
Just under a per cent or roughly half of this two-percentage point increase, happens in the first half of the year. Large rate declines are still anticipated in Q1 as post-holiday trucking demand weakens and long-haul dry van linehaul rates are expected to trough at the same roughly $1.60 per mile by April or early May expected in our previous forecast. It’s purely the higher starting point in January that is driving the first-half increase. This forecast does not embed a premium for additional winter storm activity.
The remaining portion of the 2% forecasted increase for 2026, just over one percent, is due to tightening capacity, primarily reflected in the second half of the year. With a shrinking pool of carriers, disruptions result in a stronger magnitude of rate increases—a trend that became more visible with Roadcheck Week in 2025. As 2026 progresses, both seasonal disruptions and unexpected shocks are likely to translate into higher cost increases.
The outsized reaction to these moderate weather events exiting the year suggests the market is incrementally closer to transitioning than it was at present last year, while not yet entering a new phase.
Several data points support this interpretation:
- Although capacity has decreased, it still remains above historical norms and recent tightness appears largely driven by weather impacts, reduced carrier and driver availability around the holidays.
- Key freight demand indicators remain muted to modest growth y/y, suggesting demand-side pressures are not yet driving a broader market shift.
- Imports from Asia, though seasonally increasing ahead of Lunar New Year on 15 February, are meaningfully down y/y and expected to reduce by mid-February. (See more Ocean Delivering insights here).
- Route guide depth data (detailed below) increased more than seasonally expected in December but is showing signs of normalising.
Consistent with MIT research sponsored by C.H. Robinson, this environment underscores that spot rate movements in isolation are insufficient to define a market transition; sustained changes in contractual pricing must be present. The research also found that certain demand indicators and route guide performance remain critical signals to monitor, on top of active carrier counts. With contractual conditions largely holding, demand indicators still muted and capacity remaining above historical norms, current dynamics point to heightened seasonal disruption rather than a confirmed upcycle.
If market conditions—such as winter storms, tariffs or demand indicators—change significantly, then additional adjustments in spot rate projections for 2026 will likely be warranted.
U.S. spot market
U.S. spot market forecast: Dry van truckload
The C.H. Robinson 2026 dry van cost per mile forecast is being increased to +8% y/y.
C.H. Robinson spot market dry van truckload forecast
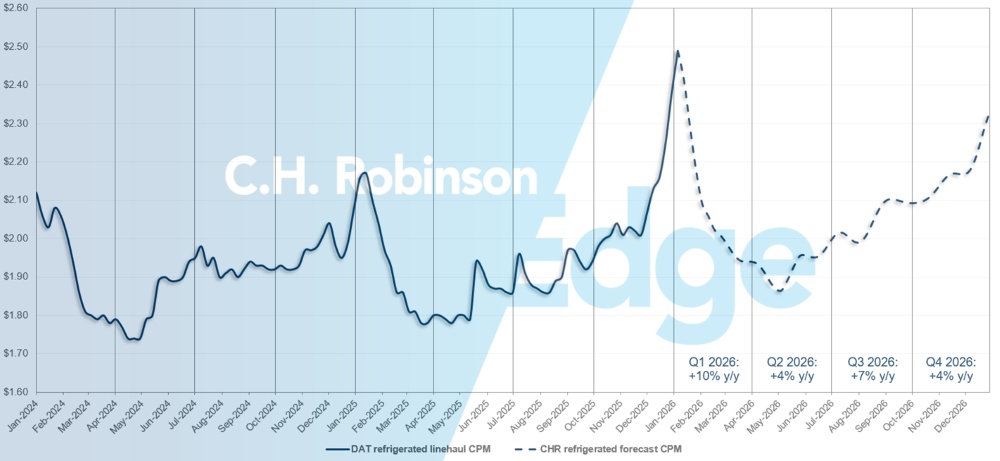
U.S. spot market forecast: Refrigerated truckload
The C.H. Robinson 2026 refrigerated van cost per mile forecast is being increased to +6% y/y.
C.H. Robinson spot market refrigerated truckload forecast
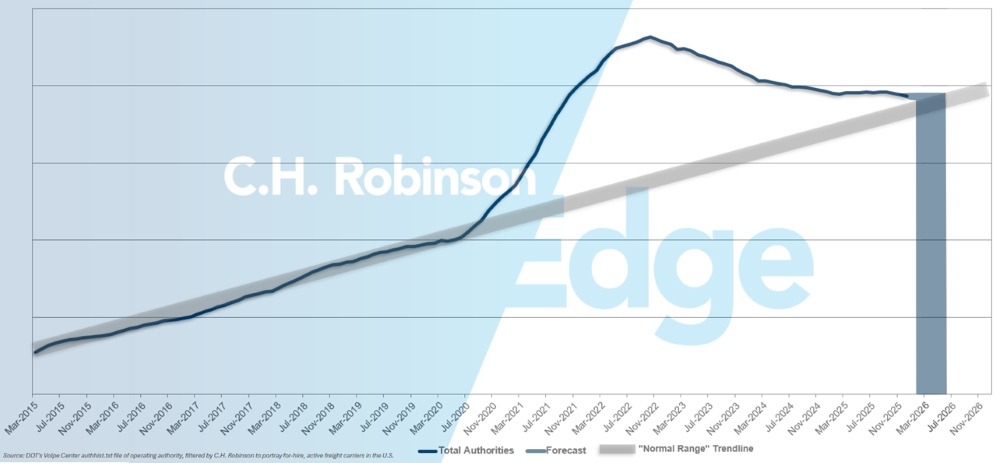
For-hire carrier authorities forecast
If the current pace of U.S. carrier attrition continues, carrier authority counts would return to historical levels in early 2026, possibly later.
For-hire carrier forecast
Contract truckload environment
The impact of recent market tightness has not been uniform across shippers, in large part due to differences in exposure to the spot versus contractual market. Smaller shippers, which tend to rely more heavily on the spot market, are more likely to have felt the effects of recent rate increases and reduced coverage over the past several weeks.
Larger shippers, by contrast, typically move the majority of their freight under contractual agreements, where pricing and service levels have remained comparatively more stable despite seasonal and weather-related disruptions.
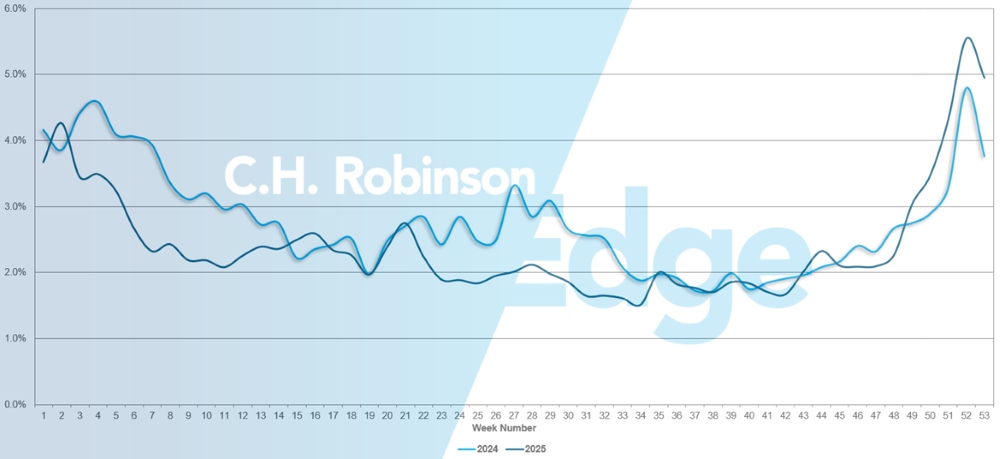
Route guide depth is an indicator of how far a shipper needs to go into their list of backup carriers when the carrier originally awarded the freight rejects a tender. Route guide depth has remained flat at a historically low level for approximately two years, until recently. But even as route guide depth increased, little contract freight failed in the route guide and had to move on the spot market.
As shown in the chart below, route guide failure at the end of 2025 closely followed the previous year’s trend. During the week when trucking capacity was tightest, Christmas week, failures slightly breached 5%, meaning that at worst, approximately 95% of freight moved within route guides as planned.
Route Guide Failures
Route guide performance has also varied based on portfolio strategy. Shippers that emphasised lowest-cost carrier selection in their RFPs during the prolonged soft market are more likely to have gone deeper into the route guide or saw route guide failure, thus experiencing a much higher increase in rates. Shippers that maintained a more balanced approach in choosing carriers by prioritising a mix of cost, service reliability and strategic relationships are generally seeing better continuity—even if some stress has emerged.
For shippers evaluating how market dynamics may affect rates and route guide resilience, it’s important to take into account their carrier mix.
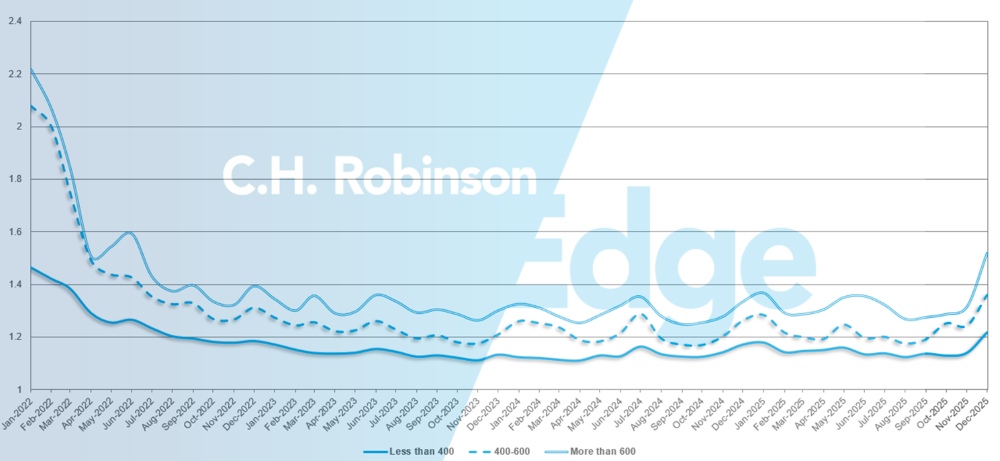
As displayed in the following chart, a route guide depth of 1 would be perfect performance and 2 would be extremely poor. For the month of December, route guide depth across North America deliveries was 1.33—the most significant increase in several years.
For long hauls of more than 600 miles, route guide depth in December 2025 was 1.52, which is worse compared to the month of November 2025 at 1.31 and worse compared to December 2024, which was at 1.33. The trend for hauls of less than 400 miles is similar. Route guide depth for December 2025 on these shorter hauls was 1.22, which is worse than the previous month of 1.14 and worse than December 2024 at 1.17.
North America route guide depth: By length of haul
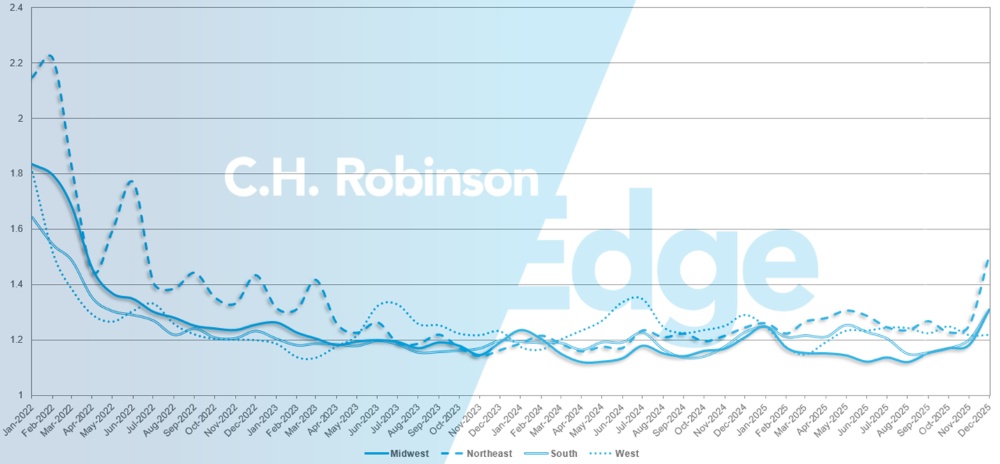
Geographically, the West experienced the smallest change of all regions, remaining flat from the previous month, while the Northeast, where winter weather was very impactful on delivering, experienced the largest change, worsening by 16.9%.
U.S. route guide depth: By region
Refrigerated Truckload
East Coast United States
The marketplace has been tighter than in recent years, reflecting both seasonal patterns and earlier-than-normal winter weather impacts. At this point, there are no clear signals that these conditions will persist beyond the typical seasonal timeframe. The market is expected to experience short-term stress throughout January, until freight volumes normalise following the New Year.
In the Southeast, fresh produce volumes above typical levels for this time of year are being observed, but are expected to gradually decline until the start of the spring season in March. Demand will begin ramping in preparation for Valentine’s Day floral deliveries out of Miami, but significant impacts on the market are not expected until volumes peak in February.
In the Northeast, demand has increased as usual, driven in part by weather disruptions. Demand should moderate post-holidays, with winter storms being the primary factors influencing capacity and rates.
Overall, the market is expected to follow familiar seasonal patterns, with near-term volatility driven by weather and post-holiday normalisation, before entering more predictable early-year patterns.
Central United States
The Midwest has experienced tightening in recent weeks, with conditions expected to persist into early 2026. Weather events continue to contribute to temporary disruptions, though milder conditions with less snow and temperatures above zero are expected to help stabilise the market.
Out of Texas, capacity remains available, with pricing largely dependant on specific load dynamics. Out of Arkansas, Missouri and Kansas, capacity is generally accessible but tighter, making same-day moves more limited and comparatively more expensive.
Overall, market conditions are reflecting seasonal and weather-driven factors rather than broader structural changes, with near-term dynamics likely to moderate as winter conditions ease.
West Coast United States
Overall market conditions in December were tighter than usual, resulting in elevated costs, which aligns with historical trends for the final two weeks before the holidays. Key stress points include the Pacific Northwest, where capacity remains constrained due to weather and road closures. Additional pressure has been noted on lanes from Arizona to California and Southern California to Northern California. Over-the-road capacity has generally remained available, though cost impacts are more pronounced, largely driven by weather-related delays.
In January, historical patterns suggest activity slowing across most western regions as carriers reposition equipment. Rates into the Southeast often decline as trucks move toward Florida, while Pacific Northwest activity diminishes after holiday freight volumes taper. Market impacts in Central and Southern California are typically driven by weather. Overall, these dynamics suggest a return toward more normalised conditions as the post-holiday market settles.
Flatbed truckload
Recent economic indicators suggest a measured and relatively flat flatbed market. Domestic manufacturing activity as defined by ISM’s Manufacturing Purchasing Manager’s Index (PMI) contracted for the tenth consecutive month in December, reinforcing the broader theme of muted industrial momentum.
Housing data presents a similar picture. The Housing Market Index showed modest improvement in December, with current sales conditions rising one point to 42 and six-month sales expectations increasing by one point to 52, while prospective buyer traffic remained unchanged at 26.
Collectively, these readings point to stabilisation rather than growth, supporting expectations for limited upside in construction-driven flatbed demand.
Given these conditions, flatbed market dynamics are expected to remain relatively steady into early 2026. Rates for 2025 were expected to finish with low single-digit growth y/y followed by a slightly stronger, yet modest, increase in 2026.
While shifts in interest rates, policy or other external factors could alter expectations, there are currently no clear signals indicating a meaningful change in demand. Notably, flatbed continues to operate differently than other truckload modes, with fewer widespread capacity constraints outside of typical seasonal pockets.
Seasonal patterns are likely to play a larger role over the next two to three months, particularly in northern and other weather-sensitive regions. Winter conditions have already created inbound and outbound challenges in select areas and further snow or prolonged freezing temperatures could continue to affect local service and pricing.
As carriers adjust routeing preferences, flexibility will be increasingly important. Planning ahead with extended lead times, adjusting scheduling and equipment expectations and staying closely connected with your C.H. Robinson expert will be key to navigating winter disruptions while maintaining service and cost stability into the new year.
Voice of the carrier
Observations from a cross-section of the contract carriers in the C.H. Robinson network:
Market
- Capacity has tightened in many areas, particularly the Midwest, leading to high spot rates. Although carriers view this as a temporary spike likely to ease post-holiday.
- Large bids have mostly concluded, with ongoing activity mostly from smaller bids.
- Carriers remain cautiously optimistic about potential market shifts as networks stabilise and demand normalises.
Drivers
- Driver availability remains strong, with retention levels comfortable and turnover low. Many drivers took extended time off for the holidays.
- Networks may face short-term driver shortages post-holiday.
- Some carriers have noted slight increases in driver pay.
Equipment
- Equipment availability is sufficient, with no current shortages; new equipment costs are high, though some opportunities exist in the used market.
- The cost of maintenance, parts and technician labour continues to increase.
- Overall, carriers are managing equipment needs effectively despite elevated costs.
 Actionable freight insights